Abstract
Background: Avatrombopag (AVA) is a recently FDA- and EMA-approved TPO-RA for adults suffering with chronic ITP. AVA is orally-administered, does not have food type restrictions, and does not carry a boxed warning for hepatoxicity or require liver function monitoring. The ASH Guidelines for the management of ITP suggest consideration of TPO-RAs as subsequent therapy following an insufficient response to first-line treatments, especially if seeking a durable platelet response (Neunert, 2019).
Aims: Given the above potential advantages for patient compliance with AVA, our aim is to evaluate the length of therapy (LOT) and persistence (PER) of treatment with an FDA-approved TPO-RA (avatrombopag (AVA), eltrombopag (ELT) or romiplostim (ROMI) in adult ITP patients in the US. We previously reported a similar real world claims analysis for the 2019 calendar yearand evaluate the 2020 calendar year in the current analysis (Vredenburg, 2021).
Methods: The Symphony Health Claims Database was used to understand LOT and PER for ELT, ROMI, and AVA in US adult ITP patients. Claims data were evaluated and inclusion in the analyses required a D69.3 or D69.49 ICD-10 diagnostic code for ITP and ≥ 1 first-initiated claim for ELT, ROMI, and AVA during the 2020 calendar year. Evaluation of LOT and PER measures were determined over a 365 day period following a patient's first TPO-RA claim during the 2020 calendar year. Data from a closed system of specialty pharmacies (CVS, Accredo, Biologics, Kroger, PharmaCord, Panther) within the 2020 calendar year was also separately used for AVA given the small number of AVA patients in the Symphony Claims Database. Adult patients with a D69.3 or D69.49 ICD-10 diagnostic code, receiving ≥ 1 initial shipment of AVA from January 2020 through December 2020 were included in this evaluation, with LOT and PER calculated over the first 365 days following initial shipment of AVA from the specialty pharmacy. In the Symphony Claims database, days of supply were considered to be 7 days per administration for ROMI and were provided specifically in each claim for ELT and AVA, with no cap on supply. In the AVA closed specialty pharmacy database, days of supply for AVA were provided by the specialty pharmacy with a maximum of 90 days per shipment.
LOT for each TPO-RA was determined by calculating the time between the first claim/shipment date and the last claim/shipment date within the 365 day threshold, while adding on the number of days of supply provided in the last claim/shipment up to the 365 day threshold.
PER for each TPO-RA were determined by the calendar months in which claims/shipments occurred. If the month of the last fill date for a product (within the first 365 days of the first fill date) is greater or equal to the month of the first fill date, then that patient is considered persistent for every month between those two months (endpoint inclusive). Unlike LOT, PER did not add the number of days of supply to the last evaluable claim/shipment. For each therapy, gaps in claims/shipments were allowed within the 365 threshold, with no max duration between data points.
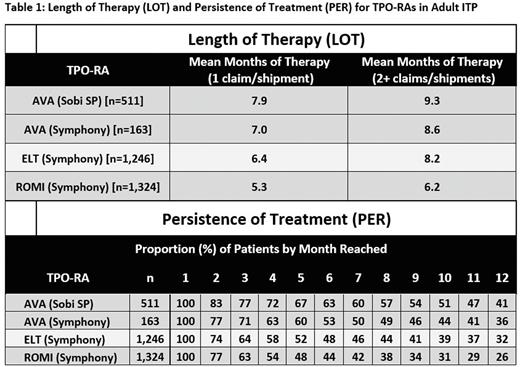
Results: LOT and PER for each TPO-RA are shown below (Table 1). 511 unique AVA patients were captured via specialty pharmacy data and 163 unique AVA patients had evaluable claims. 1,400 ELT and 1,283 ROMI patients had evaluable claims. Using figures from either the Symphony Database or the closed specialty pharmacy database, LOT was highest in AVA patients regardless of whether a conservative single claim/shipment or ≥ 2 claims/shipments were used for inclusion, with a maximum AVA mean LOT of 9.3 months of therapy. PER for each individual month reached was highest for AVA, with the median AVA patient persistenting to approximately 10 months of treatment in the specialty pharmacy data set and 7 months in the Symphony Claims data set.
Conclusions: These data suggest that AVA had greater length of treatment and higher rates of persistence than other TPO-RAs, which may be due to several variables including route of administration, convenience, patient preference, efficacy, side effects, and/or insurance coverage. These data are similar to what has been previously reported for the 2019 calendar year and also demonstrate AVA's favorable LOT and PER occur when using either claims data or specialty pharmacy prescription data. The results should be interpreted in the context of the limitations of different data sources and low overall numbers of AVA claims.
Disclosures
Kolodny:Sobi, Inc.: Current Employment. Jamieson:Sobi, Inc.: Current Employment. Darden:Sobi, Inc.: Current Employment.
Author notes
Asterisk with author names denotes non-ASH members.


This feature is available to Subscribers Only
Sign In or Create an Account Close Modal